April 22, 2026
Private Wealth Management
Executive Summary
Market snapshot and sizing
- Global HNWI wealth recovered in 2023 to approximately $86.8T (+4.7% YoY) with the HNWI population at roughly 22.8M; North America remains the largest pool, Asia rebounded with equity markets and China reopening uncertainty still a swing factor.
- Scale anchors: client assets at leading global platforms are measured in multi‑trillion dollars—Morgan Stanley Wealth Management (~$5T, 2023 YE), UBS Global Wealth Management (~$4T invested assets post‑Credit Suisse integration, mid‑2024), and Bank of America/Merrill GWIM (>~$3T).
- US independent advisor ecosystem is large and fragmented: ~15k SEC‑registered investment advisers with aggregate AUM well over $100T (majority institutional), while the RIA retail/advised segment and custody platforms (e.g., Schwab’s advisor channel near ~$4T) form a substantial PWM TAM.
- Revenue pool outlook: multiple industry outlooks point to mid‑single‑digit growth in wealth‑management revenues through 2030, benefiting from market beta, net new assets, and deepening wallet share; fee compression and cash‑sweep normalization are key offsets.
Competitive landscape and business models (who wins and why)
- Structural differentiation levers
- Cross‑sell breadth: lending (securities‑based lending, residential/CRE), deposits, trust/estate admin, and alternatives access are the most defensible share‑of‑wallet expanders.
- Focused expertise: tax alpha (direct indexing, ongoing tax‑loss harvesting), complex planning (trusts, philanthropy, business succession), and UHNW family‑office services drive premium pricing and retention.
- Access and curation: differentiated private markets, co‑/direct PE deals, club access, and curated managers via platforms (iCapital, CAIS) are increasingly table stakes for UHNW/MFOs.
Channel map and typical economics
| Channel / model | Named examples | Typical platform/client asset scale | Primary revenue model | Notable differentiators |
|---|---|---|---|---|
| Wirehouses & global private banks | Morgan Stanley, Merrill (BofA), UBS, JPMorgan PB | Individual platforms at multi‑trillion scale (e.g., ~3–5T+) | AUM fees (typically ~50–100 bps tiered), lending NII, banking & trust fees, alternatives placement | Full banking/lending stack, alternatives distribution, global platforms, capital markets access |
| Independent RIAs & aggregators | Focus Financial, CAPTRUST, Creative Planning, Hightower, Mercer Advisors, Dynasty platform | Firm AUM typically ~$10B–$200B+ (highly fragmented long tail) | Fiduciary AUM fees (~60–100 bps), planning retainers, OCIO | Planning‑led, open‑architecture product shelves, tax/estate depth |
| Multi‑family offices / UHNW boutiques | Rockefeller Capital Mgmt, Bessemer Trust, Northern Trust Wealth, Pathstone | ~$20B–$200B+ per firm | AUM/advisory fees, family‑office retainers, trust admin, co‑investment economics | Complex admin, PE/VC access, governance/education, global structuring |
| Independent broker‑dealers & advisor OS/TAMPs | LPL (brokerage/AWM >$1T), Raymond James, Envestnet, AssetMark, SEI | From ~$100B to >$1T client assets; large platforms span trillions (AUA) | Advisory platform fees (e.g., TAMP 10–35 bps), product revenue share, brokerage, data/tech | Advisor operating system, outsourced investment mgmt, product shelf scale |
| Digital/neo and hybrid advice | Vanguard PAS (>~$350B), Schwab Intelligent Portfolios, Betterment | Hundreds of billions across leading players | Low‑bps advisory (15–30 bps), subscription/retainer | Low‑cost beta + planning at scale; automation‑first |
Key growth drivers vs. headwinds
- Secular tailwinds
- Market beta and net flows: HNWI wealth expansion (2023 rebound) and the long‑horizon wealth transfer in the US (tens of trillions through 2045) expand the advisory pie.
- Product mix shift: increasing penetration of private markets/alternatives in advised portfolios via curated platforms; family offices signal ongoing appetite for PE direct/co‑investments.
- Banking integration: SBL and deposit cross‑sell deepen economics and improve retention; platforms with full banking stacks sustain higher share of wallet.
- Headwinds/risks
- Fee compression and commoditization of portfolio construction; differentiation must come from planning, tax, and access.
- Regulatory scrutiny of AI, conflicts, and marketing; operational lift for surveillance and disclosures.
- Interest‑rate normalization reduces cash‑sweep windfalls at brokers/custodians vs. 2022–2023 highs.
Technology and AI stack (where value is accruing)
- Advisor operating systems are consolidating around large platforms
- Envestnet reported platform assets in the mid‑trillions (AUA/AUM combined), monetizing via platform bps, data/analytics, and exchanges.
- Addepar surpassed ~$5T in assets on platform, reflecting demand for performance reporting and alternatives look‑through among RIAs/MFOs.
- Custody concentration: Schwab’s advisor platform around the mid‑$3T–$4T range post‑TD integration; Fidelity and Pershing remain scaled alternatives.
- Alternatives access infrastructure
- iCapital reports platform assets well into the hundred‑billion‑plus range, enabling wirehouses/RIAs to distribute institutional PE/PD/RE/credit; CAIS building in the RIA/IBD channel.
- AI in production
- Morgan Stanley rolled out a GenAI assistant (with OpenAI) to thousands of FAs to retrieve research, policies, and product content—early proof of productivity lift at scale.
- Emerging use cases: automated meeting prep and note summarization, personalized client communications, KYC/AML and trade surveillance, anomaly detection for compliance, next‑best‑action for cross‑sell; constraints include data governance and evolving SEC guidance on predictive analytics.
Implications for an investment thesis
- Picks‑and‑shovels platforms with durable, usage‑based revenue
- Priority: advisor OS layers (TAMPs, reporting, planning, data pipes) with multi‑custodial footprints, low churn, and clear expansion levers (alternatives exchange, tax optimization, lending marketplaces).
- UHNW/MFO service platforms
- Roll‑up or build‑out of scaled MFOs with trust/admin cores, alternative access, and co‑investment syndication; earnings resilience via retainers + AUM.
- Alternatives distribution to the mass‑affluent/RIA channel
- Back minority growth capital in platforms connecting quality managers with compliant subscription, liquidity, and K‑1 automation; focus on manager curation and operational plumbing.
- Tax technology and planning tooling
- Direct indexing/tax automation, entity/trust workflow, and estate modeling vendors; attach to custodial data and planning systems; monetization via seat + asset‑based fees.
- Advisor productivity AI
- Vertical copilots embedded in CRM/portfolio tools with robust retrieval‑augmented generation over firm content and audit trails; near‑term revenue via seat upsells and measurable time savings.
What to watch (12–24 months)
- Consolidation cadence in RIAs/TAMPs; potential public‑to‑private opportunities as rates normalize and valuations compress/expand.
- Regulatory outcomes on AI/predictive analytics and retail alternatives; compliance burden could favor scaled, well‑capitalized platforms.
- Cash‑sweep normalization and client migration to higher‑yield vehicles; NII headwinds for brokerage‑centric models.
- Adoption curves for alternatives in advisor portfolios; attach rates across wirehouse vs. RIA channels.
Immediate next steps for PE diligence
- Market map and sizing
- Quantify revenue pools by channel (wirehouse, private bank, RIA, IBD/TAMP, digital) and by product (advisory fees, lending, alternatives placement), triangulating public disclosures and custodian data.
- Target screening
- Build a list of scaled RIAs/MFO platforms ($10B–$100B+ AUM), advisor OS/TAMP vendors (>$50B AUA, >90% gross retention), and alt‑access networks (>$10B annual subscription volume) for outreach.
- Thematic workstreams
- Underwrite unit economics for advisor OS (ARPU, bps take, retention), compliance/AI spend trajectories, and cross‑sell attach rates (SBL, alts) by channel; validate with custodian and due‑diligence references.
- Risk assessment
- Model fee‑rate compression and NII normalization scenarios; include regulatory timing/impact sensitivity for AI and retail alternatives.
Selected data points (for quick reference)
- HNWI wealth: ~$86.8T (2023); HNWI population ~22.8M (Capgemini).
- Platform scale: Morgan Stanley WM client assets ~ $5T (2023 YE); UBS GWM invested assets ~ $4T (mid‑2024); BofA/Merrill GWIM >$3T; Schwab total client assets ~mid‑$8T with advisor channel near ~$4T.
- Advisor OS scale: Envestnet platform assets >$5T (AUA/AUM); Addepar assets on platform >$5T; iCapital platform assets >$170B.
- AI at scale: Morgan Stanley deployed a GenAI assistant to its FA workforce in 2023; SEC proposed rules on predictive analytics use in advisory/brokerage contexts—compliance design is a first‑order product requirement.
Notes on data gaps
- Reported figures are drawn from public filings and industry reports at differing dates (2023–2024). Some sub‑segments (e.g., RIA retail AUM share within total SEC‑registered AUM) lack consistent public breakouts; estimates are shown as ranges where appropriate and should be refined in confirmatory diligence using custodian and consultant datasets.
Total Addressable Market (TAM)
Scope and definitions
- Scope: recurring fee revenues from discretionary/non‑discretionary portfolio management and advice for HNW/UHNW individuals (primary PWM core). Excludes mass‑market brokerage, workplace/retirement plan admin, and pure retail banking. Notes on adjacencies and sensitivity are provided.
- Currency: USD. Figures are directional ranges using the latest accessible third‑party data; we avoid point estimates where sources conflict.
Methodology (bottom‑up)
- Start with client asset pools by wealth band.
- HNWI (>$1m investable): Capgemini estimates $86.8T global HNWI wealth in 2023 (record high after 2022 decline).
- Apply the share of assets actually intermediated by wealth managers (vs. self‑directed, workplace plans, direct private deals).
- We assume 60–70% of HNWI assets are with professional wealth providers, consistent with industry disclosures and client advice uptake in HNW.
- Apply revenue yield (bps) on advised assets to derive fee revenue TAM.
- Blended revenue yield 50–90 bps: lower for UHNW/family offices and mega‑accounts; higher for mass‑HNW with planning bundled. Benchmarks from wirehouse/RIA disclosures and pricing schedules.
- Sensitivities: Show impact of (a) penetration ±10ppt and (b) fee yield ±10bps.
Core PWM TAM (advisory/management fees) – results
- Global HNW/UHNW: $300B–$550B annual revenue
- Asset base: ~$86.8T (HNWI wealth, 2023)
- Assumed advised penetration: 60–70% → ~$52–$61T advised
- Yield: 50–90 bps → ~$260B–$549B; midpoint ≈ ~$400B
- Regional view (directional):
- North America HNWI wealth ~$27.7T (2023) → core PWM fees ≈ $85B–$175B (same assumptions)
- APAC HNWI wealth rebounded in 2023; EMEA stable-to‑up modestly. Applying the same ranges implies APAC and EMEA each contribute high‑double‑digit billions to low‑hundreds of billions combined.
Table: Illustrative bottom‑up TAM (HNWI/UHNW only)
| Input | Low | Mid | High |
|---|---|---|---|
| HNWI wealth (2023) | $86.8T | $86.8T | $86.8T |
| Advised penetration | 60% | 65% | 70% |
| Advised assets | $52.1T | $56.4T | $60.8T |
| Fee yield (bps) | 50 | 70 | 90 |
| Core PWM fee TAM | $260B | ~$395B | ~$548B |
What’s excluded from the core TAM (and why it matters)
- Banking/NII and lending to PWM clients (deposits, SBL/mortgages): material at universal banks/wirehouses and can add 20–35% to total PWM revenue pools depending on rate cycle and balance mix. Public segment disclosures at Morgan Stanley, BofA/Merrill, UBS indicate NII is a double‑digit percent of segment revenues, but definitions vary; to avoid double counting and cycle‑sensitive distortions, we present advisory/management fee TAM separately and flag the uplift.
- Mass‑affluent advice: sizable but heterogeneous (hybrid brokerage/advice, workplace assets, digital/human advice). Including it without country‑level penetration data risks overstating TAM and mixing retail brokerage economics with PWM. If included, global advice TAM would be larger by a meaningful multiple; see “Next steps” for how to size it rigorously.
Growth indicators
- HNWI wealth grew to a record ~$86.8T in 2023; population reached ~22.8M (+~5% YoY). Asset growth and net new money are key drivers of fee TAM expansion.
- BCG projects personal financial wealth to resume mid‑single‑digit CAGR through 2027–2030 after the 2022 drawdown, implying a structurally expanding PWM fee pool (holding pricing/penetration roughly stable).
Implications for investment thesis
- Scale platforms leveraged to HNW/UHNW flows can address a ~$0.3–0.55T annual fee pool, with additional upside from client banking/lending revenues.
- Pricing pressure at the top end (UHNW) and migration to alternatives/direct deals compress bps but expand wallet share in private markets, creating product/platform upsell opportunities.
- Regions with faster AUM growth (e.g., APAC) and advisor‑capacity gaps are likely to outgrow mature North America on a percentage basis, albeit off a smaller base.
WealthTech/AI enablement TAM (separate, for software and data vendors)
- US advisor software spend (bottom‑up):
- ~300k–320k US financial advisors (Cerulli; range quoted across recent years)
- Average core tech stack spend per advisor ≈ $10k–$20k/year (CRM, planning, portfolio accounting/rebalancing, risk, client portal; Kitces/Schwab benchmarks)
- US WealthTech software TAM ≈ $3B–$6B annually, excluding data feeds, market data, and enterprise platforms at wirehouses.
- Global extrapolation: limited public counts of non‑US advisors; applying a 2–3x multiplier to the US base (to reflect EMEA+APAC advisor populations and bank‑owned platforms) implies a rough global software TAM on the order of $6B–$15B, pending better advisor census and enterprise IT budget data.
Key assumptions and how to diligence
- Advised penetration (60–70%): validate by combining (i) platform AUM disclosures from top wealth managers with (ii) Capgemini/BCG wealth pools by region; reconcile against self‑directed brokerage balances.
- Fee yield (50–90 bps): triangulate using wirehouse published fee‐based asset yields and RIA fee schedules (e.g., ~1% on first $1M, step‑downs thereafter) and adjust for cash/alternatives mix.
- For software TAM: corroborate per‑advisor spend from Kitces and Schwab studies with vendor ARPU disclosures (e.g., Envestnet, Orion, SEI) and segment by RIA vs. bank/wirehouse enterprise deals.
Next steps to refine TAM for deal work
- Build a region‑by‑region model with: HNWI wealth, advised penetration, and yield by band (mass‑HNW vs UHNW). Use primary interviews to tighten penetration and pricing by channel (RIA vs private bank vs wirehouse).
- Add a banking/lending revenue layer by applying margin per $ of client cash/loans using disclosed deposit/SBL balances at major platforms.
- Size the mass‑affluent advice pool by country using retail investable asset data and advice penetration from local regulators/associations; separate hybrid brokerage from fiduciary advice to avoid double counting.
- For WealthTech, assemble an advisor census (US, UK, EU, Canada, Australia, HK/SG) and map stack penetration to derive category‑level TAM (planning, portfolio accounting, rebalancing, CRM, risk, client portal, data/AI).
Retention/NRR
Key takeaways on stickiness
- PWM client relationships are sticky: mature RIAs and private banks generally report annual client retention in the mid-to-high 90% range, with asset/fund retention often >95%. Named disclosures are sparse, but available datapoints (e.g., St. James’s Place “fund retention” ~96%+) and RIA benchmarking support this.
- Revenue NRR is market-sensitive: because fees are AUM-based, NRR can exceed 100% in rising markets (market beta + cross‑sell + net flows) and fall below 100% in down markets despite positive net flows.
- Two structural leakage points: (1) advisor departure (clients follow the advisor), and (2) intergenerational transfer (a majority of heirs change advisors). Multi‑product penetration (banking/lending, alternatives, tax, family services) and early next‑gen engagement materially improve retention.
Benchmarks and named datapoints (where available)
- St. James’s Place (UK, ~£168bn AUA): consistently reports “fund retention” around 96%+ in recent years, underscoring defensibility of advised relationships at scale.
- RIA channel: Schwab’s RIA Benchmarking Study indicates median client retention in the mid‑to‑high 90% range for established firms; attrition typically low single digits in normal markets. Precise figures vary by firm size and client mix.
- Consolidators: Focus Financial’s filings (pre take‑private) highlighted historically low client attrition at partner firms (characterized as low single digits), driven by advisor-led relationships and recurring AUM fees.
- Intergenerational risk: Multiple industry studies (Cerulli, Fidelity, Capgemini) find the majority of heirs do not keep their parents’ advisor—often cited as well over half—making next‑gen engagement a key NRR lever.
- Satisfaction/omnichannel: J.D. Power research links higher digital engagement and trust to stronger intent to consolidate assets and remain, reinforcing cross‑channel service as a defense.
How to think about NRR in PWM (and why it differs from SaaS)
- Construct: NRR ≈ prior-year revenue from the same households adjusted for (a) lost households/AUM, (b) expansion via pricing, wallet-share/cross‑sell (banking, SBL, alternatives, tax planning), (c) net flows from existing households, and (d) market performance on retained/expanded AUM. Most firms do not disclose NRR; diligence must reconstruct it.
- Practical segmentation:
- NRR ex‑market: removes market beta to isolate relationship stickiness and upsell. A healthy mature RIA often targets ~100%+ ex‑market NRR via cross‑sell and net flows from existing clients.
- Total NRR: swings materially with markets. 2022 bear market drove revenue down double digits across many managers despite positive organic flows; 2023 rebound reversed the effect.
- Drivers of higher NRR:
- Multi‑product attach: securities‑based lending, deposits/credit cards, alternatives access, estate/tax planning, and bill‑pay/family office services.
- Platform/custody integration: embedded workflows, portals, and data aggregation reduce switching.
- Next‑gen engagement: formal programs to onboard spouses/heirs (e.g., family meetings, education) and to capture assets pre‑inheritance.
Illustrative NRR by market regime (not company‑specific)
- Flat market: modest churn (2–4%) offset by cross‑sell and net flows from existing clients (3–5%) → ex‑market NRR slightly >100%.
- Bull market: ex‑market NRR slightly >100% plus market uplift → total NRR can reach 110–120%.
- Bear market: ex‑market NRR ~100% but negative market performance (e.g., −10% to −20%) pulls total NRR below 100%.
Implications for an investment thesis
- High baseline retention is an asset, but upside depends on improving ex‑market NRR via product attach and next‑gen capture. Platforms with bank capabilities (SBL/deposits) and alternatives distribution typically show superior ARPU expansion and NRR resilience.
- Concentration risk: advisor-centric books mean client retention hinges on advisor retention; equity participation, earnouts, and service teams are critical defenses post-acquisition.
- Value-creation levers to underwrite:
- Lift ex‑market NRR: increase product penetration (SBL per $AUM, alternatives allocation, tax/estate packages), deepen share of wallet, and implement systematic family engagement.
- Reduce leakage: strengthen advisor retention (contracts, culture, equity), add team-based coverage, and measure next‑gen contacts per household.
- Data discipline: stand up cohort-based NRR reporting (household-level) and separate market vs. organic effects to manage true stickiness.
Diligence checklist (KPIs and artifacts)
- Historical client and AUM churn by cohort; asset retention after advisor departures; retention by segment (HNW vs. UHNW vs. mass‑affluent).
- Ex‑market NRR by vintage; contribution from cross‑sell (banking/lending NII, alternatives placement fees, planning packages) and from existing-client net flows.
- Intergenerational readiness: % of households with documented spouse/heir relationships; % of heirs with portal access; next‑gen AUM before inheritance.
- Product attach: SBL balances and utilization per $AUM; alternatives penetration; tax/estate plan adoption; digital engagement metrics tied to retention.
- Competitive context: custody/platform dependencies that could affect retention (e.g., pricing, service changes at custodians).
Data gaps to note
- Few U.S. wealth managers disclose client retention or NRR explicitly; public proxies are asset/fund retention and qualitative statements in filings and benchmarking studies. Build a bottoms‑up NRR view during diligence using household‑level data, market adjustments, and product attach metrics.
Pricing
Key pricing models and typical price points
AUM-based advisory fees (dominant across RIAs, private banks, wirehouses)
- Typical schedule: ~1.00% at $1M; ~0.80–0.90% at $2M; ~0.60–0.75% at $5M; ~0.40–0.60% at $10M+. UHNW (>$25M) often negotiates to <50 bps. (Kitces 2022 advisor fee study)
- Robo/hybrid anchors lower-end pricing: Vanguard PAS 0.30%; Schwab Intelligent Portfolios 0% advisory fee (firm monetizes cash sweep); Betterment 0.25–0.40%; Wealthfront 0.25%.
Wrap/managed account “program” fees (wirehouses and broker-dealers)
- Published maximum schedules typically 2.0–2.5% all-in (advice, trading, manager fees); realized fees are often discounted, especially for larger households. (Merrill, UBS, Morgan Stanley Form ADV brochures)
Commission- and product-based revenues (brokerage, B/D affiliates)
- Mutual funds: 12b‑1 distribution and service fees can total up to 1.00% annually; front-end loads on A‑shares can be as high as ~5%+ depending on fund family. (FINRA Rule 2341; FINRA investor education)
- Non-traded alternatives: share-class-specific selling commissions and ongoing servicing fees are common (e.g., Blackstone BREIT Class S: up to 3.5% upfront commission + 0.85% dealer manager fee; ongoing stockholder servicing fees on certain classes). (BREIT prospectus)
- Equities/ETFs brokerage: most retail online trades are now $0; advisor-assisted trades may still incur ticket charges at some firms. (Broker disclosures)
Flat fee/subscription and hourly (financial planning-centric models)
- Annual planning retainers commonly ~$3k–$10k for mass affluent households; hourly planning $200–$500+; project-based planning $1k–$6k+. Often paired with reduced AUM bps or used when no AUM is managed. (Kitces 2022)
Performance-based fees (niche)
- Rare in mainstream PWM; permitted mainly for “qualified clients” and typically 10–20% of gains over a hurdle/benchmark in hedge-style SMAs or private strategies. (SEC 17 CFR 275.205‑3)
Illustrative pricing landscape (select examples)
| Model | Indicative client price points | Notable examples |
|---|---|---|
| AUM-based advisory | 1.00% at $1M; 0.70% at $5M; 0.50% at $10M (median schedules) | Typical RIA breakpoints (Kitces 2022) |
| Wirehouse wrap | Max schedules up to ~2.2–2.5% all-in; large households often discounted | Merrill Advisory Program (max ~2.2%); UBS Strategic Advisor/Morgan Stanley wrap brochures (max ~2.5%) |
| Robo/hybrid | 0–0.40% | Vanguard PAS 0.30%; Schwab Intelligent Portfolios 0% (cash monetization); Betterment 0.25–0.40%; Wealthfront 0.25% |
| Mutual fund distribution | Up to 1.00% annual 12b‑1; front-end loads often 3–5.75% | FINRA Rule 2341; fund family share class disclosures |
| Non-traded REIT/BDC share classes | Upfront 0–3.5%+; ongoing servicing 0–1% depending on class | BREIT Class S (3.5% + 0.85% dealer fee); Class I typically no upfront, lower ongoing |
| Planning retainer/subscription | ~$3k–$10k/yr; hourly $200–$500+ | Planning-led RIAs; XYPN-style models (Kitces 2022) |
| Performance fee (qualified clients) | 10–20% of gains over hurdle | Hedge-style SMAs/private strategies via PWM platforms |
Market trends and pressures
Gradual fee compression in advice; faster compression in underlying products:
- Advisory bps have been relatively stable to modestly down over recent years per RIA benchmarking studies; managers increasingly justify fees via planning, tax, and private markets access. (Schwab RIA Benchmarking)
- Fund/ETF expense ratios continue to fall (asset‑weighted U.S. fund fees ~0.37% in 2022), lowering total client all‑in costs and pressuring advisors to unbundle value. (Morningstar 2023 U.S. Fund Fee Study)
Mix shift to fee-based accounts continues: Managed/wrap and advisory programs represent the majority of client assets at major distributors, reducing pure commission revenue cyclicality. (Industry MA/wrap studies; SIFMA/Cerulli)
Alternative investments and share-class design drive non‑AUM revenue: Dealer manager/stockholder servicing fees and platform admin fees on retail‑accessible alts (non‑traded REITs/BDCs, interval funds) have become a meaningful revenue stream for broker-dealers and wealth platforms. (BREIT prospectus; platform disclosures)
Cash and balance‑sheet monetization increasingly material: Zero‑fee or low‑fee advice offerings are subsidized by net interest margin on cash sweeps and securities‑based lending spreads. This introduces rate sensitivity into PWM P&Ls. (Schwab Intelligent Portfolios pricing; custodian 10‑Ks)
Implications for a PE investment thesis
- Underwrite realized revenue yield, not list pricing: Diligence blended bps across the book (by client tier and account type), discounting from published schedules, and attach rates for planning fees and alts servicing. Expect materially lower yields in UHNW vs. mass affluent.
- Favor platforms with diversified economics: Fee‑based advice plus lending, cash NIM, and alternatives distribution can stabilize revenue through market cycles; quantify rate sensitivity and product‑mix margin.
- Pricing power correlates with differentiated access and advice: Firms with proprietary/curated private markets access, tax/estate specialization, and integrated banking retain 75–125 bps all‑in on affluent segments despite product fee compression; test willingness‑to‑pay via win/loss and churn analytics.
- Tech-enabled subscriptions expand TAM: Planning‑led, subscription/flat‑fee models open up down‑market segments and reduce AUM beta; assess CAC payback and unit economics vs. traditional AUM pricing.
Diligence checklist (next steps)
- Pull Form ADV brochures to map actual fee schedules and discounting by competitor; compare stated maximums vs. realized pricing from client statements.
- Build a cohort analysis of revenue yield (bps) by client household size, custody, account type (advisory vs. brokerage), and product mix (e.g., % in alts with servicing fees).
- Quantify non‑AUM revenue: net interest on cash and SBL, alts placement/servicing, underwriting/structured product spreads, and payment arrangements with product sponsors.
- Benchmark planning fee adoption and attach rates; test price elasticity for adding tax prep, estate planning, and alts access tiers.
- Scenario-model fee compression (5–15 bps over 3–5 years) vs. offset from mix shift to higher‑margin products/services; layer interest-rate scenarios affecting cash economics.
Key Revenue/Margin Drivers
Revenue model archetypes and unit economics
- Independent RIAs
- Primary revenues: AUM-based advisory fees (typically 60–100 bps for mass-affluent/HNW; 30–75 bps for UHNW, tiered), planning/retainer fees, limited product revenue sharing, and custodial rebates (where allowed).
- Margin profile: Owner-operated RIAs commonly deliver 20–35% operating/EBITDA margins; median operating margin for US RIAs in benchmarking studies is ~25% (pre-partner comp methodology varies). Scale, centralized ops, and high AUM/advisor drive top-quartile 30%+.
- Hybrid/Independent broker-dealers (IBDs) and OSJs (e.g., LPL)
- Primary revenues: Mix of advisory fees, brokerage commissions, alternative product placements, and net interest from cash sweeps; substantial “payout” to advisors (commission/advisory expense) drives gross margin.
- Margin profile: Advisor payout typically ~60–70% of gross revenue; adj. EBITDA margins in the low-20s are common for scaled platforms. Operating leverage improves with platform scale and bank sweep economics.
- Wirehouses/Private banks (e.g., Morgan Stanley, UBS, Bank of America Merrill, JPM, Goldman PWM)
- Primary revenues: Recurring advisory/mandate fees, transactions, net interest income (sweeps, deposits), and lending spreads (SBL, mortgages, tailored UHNW credit), plus trust/estate fees.
- Margin profile: Business-unit pre-tax margins often mid-20s to ~30% at scale; recurring fee income typically ~50%+ of segment revenue with NII and lending as cyclical uplift.
What drives revenue per dollar of client assets (ROA)
- AUM and fee rate mix
- Equity beta and net flows are the first-order levers; 60–80% of revenues in scaled wealth units are tied to client assets via mandates or asset-based pricing.
- Fee compression persists at the top end (UHNW), but mix shift to planning retainers and high-value mandates stabilizes blended ROA.
- Benchmarks: US advisors most commonly charge ~1% on the first $1M, with tiered breakpoints at higher balances; UHNW mandates often clear well below 75 bps but can be offset by banking/lending and bespoke services.
- Product mix
- Alternatives/illiquids and structured solutions increase ROA through placement and ongoing fees where permitted; retail share classes of flagship private market vehicles historically carried upfront selling/dealer fees up to low-single-digits plus ongoing trails.
- Discretionary/managed accounts and model portfolios lift pricing power and retention vs. brokerage-only.
- Banking and lending penetration
- Net interest income from sweep deposits and credit products (SBL, LOCs, mortgages) has been a major revenue swing factor post-rate hikes; penetration of lending to advised households lifts ROA and stickiness.
- Wallet capture and cross-sell
- Trust/estate administration, tax, philanthropy services, and family office administration add fee lines and improve share-of-wallet; particularly accretive in UHNW segments.
Key margin drivers and sensitivities
- Advisor compensation and productivity
- Payout/advisor comp is the largest cost line in IBD/wirehouse models; improving AUM per advisor, digital onboarding, and centralized trading/rebalancing support higher margins.
- Operating leverage and platform scale
- Centralized compliance/ops, standardized tech stacks, and custody/clearing scale reduce unit costs. Aggregators realize margin uplift from shared services and procurement.
- Revenue mix cyclicality
- Rate cycle: NII from sweep balances is highly sensitive to short rates and client cash migration; falling rates or cash-to-funds mix shifts compress margins.
- Market beta: Equity drawdowns depress AUM-fee revenue; diversified advice/planning fees partially cushion.
- Regulatory pressure on fees/inducements
- Markets that constrain commissions/retrocessions (e.g., UK post-RDR; evolving EU inducement rules) compress product-led revenues and push models toward transparent AUM/planning fees, impacting gross margin but improving durability.
Benchmark ranges (illustrative, to inform underwriting)
- Advisory fee levels (US)
- Mass-affluent/HNW: 60–100 bps blended; common headline 1% at $1M, tiering down.
- UHNW: 30–75 bps depending on mandate complexity and service bundle.
- Operating margins by model
- RIAs: ~20–35% operating/EBITDA; median around mid-20s in benchmarking.
- IBD/Hybrid platforms: Adj. EBITDA low-20s at scale; sensitive to payout and NII.
- Wirehouse/Private bank units: Pre-tax margins mid-20s to ~30% in favorable environments; targets commonly 30%+ through-the-cycle at leading franchises.
Named examples and data points
- Charles Schwab
- Revenue mix illustrates NII cyclicality: net interest revenue has been the single largest component of total net revenues in recent years, alongside asset management/administration fees; deposit betas and cash sorting meaningfully influence margins.
- LPL Financial
- Defines “gross profit” as net revenue less commission/advisory payout; gross profit typically ~one-third of net revenue, reflecting ~60–70% payout. Scale and advisory mix expansion have lifted adj. EBITDA margins into the low 20%s.
- UBS Global Wealth Management
- Recurring fee income (mandate/advisory) represents roughly half of GWM revenues, with the balance from transaction-based and net interest income; loan/deposit growth and mandate penetration are highlighted as ROA levers.
- Morgan Stanley Wealth Management
- Publicly targets through-the-cycle pre-tax margins around 30% for its WM segment; drivers include fee-based asset penetration, integrated deposits/lending (post E*TRADE acquisition), and digital scale.
- St. James’s Place (UK)
- Announced fee structure changes in response to Consumer Duty scrutiny; illustrates regulatory pressure on recurring fees and implications for profitability in advice-led models.
- Alternatives distribution
- Example: BREIT retail share classes historically disclosed upfront selling/dealer manager fees up to the low single digits, plus ongoing management and performance fees—demonstrating economics available to wealth distribution channels for private market products (subject to share class and regulation).
Where software/AI touches P&L (margin levers vs. revenue)
- Front office
- Lead sourcing, personalized outreach, proposal generation, and meeting prep via gen AI can raise advisor capacity (more households per advisor) and conversion, improving margins and organic growth without proportional headcount.
- Middle/back office
- Automated onboarding/KYC, document processing, and compliant note-taking lower non-revenue FTE needs and cycle times.
- Investment/portfolio ops
- Model portfolio automation, tax-loss harvesting, and drift monitoring improve deliverable consistency at lower cost; embedded analytics enable higher-fee discretionary mandates.
- Expected impact
- Large-scale banking/wealth studies estimate meaningful productivity uplift from gen AI across revenue and cost lines; wealth is a top-quartile use case given document-heavy workflows and relationship sales intensity.
Implications for underwriting and value creation
- Prioritize platforms with:
- High share of recurring advisory fees, growing mandate penetration, and diversified fee lines (planning, trust/estate) to dampen beta and rate sensitivity.
- Embedded banking (deposits/sweeps) and secured lending (SBL) capabilities with prudent risk controls—material ROA and retention uplift.
- Clear operating leverage path: scalable custody/clearing, centralized ops, and proven ability to lift AUM per advisor.
- Demonstrated alts/structured distribution where compliant; avoid regulatory overhang from retrocessions/inducements.
- Tech stack and data foundation to capture AI-driven productivity—focus on digital onboarding, advisor copilot, workflow automation, and model portfolio tooling.
- Diligence priorities
- Revenue composition by source (AUM-fee, NII, commissions, alts), ROA by cohort, and sensitivity analysis to 200–300 bps rate moves and a 20% equity drawdown.
- Advisor economics: payout grid, AUM/advisor, net recruiting, and retention; quantify lift from central services.
- Pricing power indicators: share of households on discretionary mandates, planning adoption, and lending penetration.
- Regulatory exposure: inducement/fee rule changes by geography; remediation investments needed.
Business Models and Market Segments
Market context and where profits pool
- Global personal financial wealth is roughly $250T+, with mid‑single‑digit CAGR expected through 2027 (driven by North America and APAC). Revenue yields in wealth management are typically well under 1% of client assets, but pretax margins in mature franchises often reach ~25% given recurring fees and operating leverage.
- In the US, retail/advised investable assets are on the order of $70T+. Channel share continues to drift from wirehouses toward independent RIAs and hybrids; RIAs are consistently cited as the fastest‑growing channel by assets and headcount.
- Scale players with integrated banking (deposits, securities‑based lending, mortgages) and alternatives distribution are expanding revenue per client; independent RIAs are competing via comprehensive planning, tax, and M&A‑enabled service breadth.
Client segments and service needs (structure and focus implications)
| Segment | Typical liquid wealth | Primary needs | Decision drivers | Pricing bands (typical) | Examples of providers |
|---|---|---|---|---|---|
| Mass affluent | ~$100k–$1M | Goal‑based planning, retirement accumulation, low‑cost diversified portfolios, tax‑aware rebalancing | Convenience, digital experience, brand, low fees | ~0.25%–1.00% of AUM; or subscription/retainer in the low‑thousands per year | Vanguard PAS, Schwab, Betterment, Fidelity |
| HNW | ~$1M–$30M | Holistic planning, tax optimization, estate/charitable, lending, alternatives access | Advisor relationship, tax alpha, one‑stop platform, lending | ~0.60%–1.00% AUM; planning retainers common; banking spreads incremental | Independent RIAs (Creative Planning, Mariner, Mercer), wirehouses (Morgan Stanley, Merrill), private banks (J.P. Morgan, Northern Trust), hybrids (LPL advisors, Cetera) |
| UHNW | $30M+ | Family governance, complex trust/estate, concentrated stock strategies, direct/club deals, multi‑jurisdiction planning | Bespoke solutions, discretion, proprietary deal flow, multi‑family office services | Often a mix: lower AUM bps + large retainers/project fees; performance fees on alternatives where applicable | J.P. Morgan Private Bank, Goldman Sachs PWM, Bessemer Trust, Rockefeller Global Family Office, Pathstone, AlTi/Tiedemann |
Business model landscape (structural differentiation, revenue mix, cross‑sell)
| Model | Who they serve (primary) | Core revenue model | Cross‑sell levers | “Access” differentiators | Named examples | Notes on scale/economics |
|---|---|---|---|---|---|---|
| Independent RIA (fee‑only fiduciary) | HNW, mass affluent | Asset‑based fees; planning retainers/projects; low to no commissions | In‑house/affiliated tax, estate, trust; insurance via third parties | Open‑architecture SMAs/UMAs; alt platforms (e.g., iCapital/CAIS) | Creative Planning (>$300B AUM/AUA), Mariner Wealth Advisors (> $100B), Edelman Financial Engines (>$250B) | High organic retention; scalable investment ops; M&A roll‑ups common; custodied at Schwab/Fidelity/Pershing |
| Hybrid RIA/independent B/D | HNW, mass affluent | Advisory fees + brokerage/insurance/annuity commissions | Product shelf revenue share; advisory platform; practice M&A financing | Home‑office diligenced alts; structured notes | LPL Financial, Cetera, Osaic | Platform takes spread on advisor payouts; large TAM via advisor recruiting |
| Wirehouse broker‑dealers | HNW, UHNW | Advisory fees + brokerage; net interest on cash; lending; product distribution | Banking cross‑sell (sweep, SBL, mortgages), IB/referrals, corporate stock plan rollovers | Institutional alts platform; capital markets access; syndicate | Morgan Stanley, Merrill (BofA), UBS, Wells Fargo | Integrated balance sheet lifts revenue per client; revenue yields generally <1% ROA on assets |
| Private banks/trust companies | HNW, UHNW | AUM fees, trust admin fees, lending spreads | Deposits, customized credit, specialty asset mgmt (oil & gas, real estate), custody | Co‑investments/feeder funds; bespoke credit; global custody | J.P. Morgan Private Bank, Northern Trust, BNY Mellon Wealth, City National | Strong stickiness via trust/credit; capital/regulatory intensity higher |
| Multifamily offices (MFOs) | UHNW | Retainers + lower AUM bps; project fees; CIO overlay | Family admin (bill pay, consolidated reporting), tax/estate coordination | Direct/club deals; manager selection; peer networks | Pathstone (>$100B), Rockefeller Global Family Office, Aspiriant, WE Family Offices | Deep relationships; lower operating leverage; growing via acquisitions |
| Single‑family offices (SFOs) | Single UHNW family | Internal cost center; sometimes mgmt‑company fees | N/A (in‑house) | Direct deals, co‑invest with GPs/peers | MSD Capital, Walton Enterprises | Not third‑party revenue; opportunity is in service providers to SFOs |
| Digital/robo and hybrid advice | Mass affluent | Low bps wrap fees; cash NIM; advice subscriptions | Banking, credit card, brokerage upsell | Automated tax‑loss harvesting; fractional SMAs | Vanguard PAS, Schwab Intelligent Portfolios, Betterment, Wealthfront | CAC‑sensitive; benefits from rate environment via cash spreads |
| Tax‑led/CPA‑affiliated wealth | Mass affluent, HNW business owners | AUM fees plus recurring tax/outsourced CFO fees | Tax prep, entity structuring, controller/CFO services | “One‑bill” household CFO; proactive tax planning | Avantax (Cetera), Mercer Advisors (in‑house tax), Creative Planning Tax, EP Wealth (CPA acquisitions) | High cross‑sell and retention; attractive for roll‑ups |
| Retirement/Workplace‑led wealth | Mass affluent, HNW via rollovers | Plan consulting bps; participant advice; rollover AUM | Rollover capture; HSA/529; equity comp advice | Embedded access to participants/executives | CAPTRUST, Edelman FE (workplace), Fidelity Workplace | Scalable distribution; regulatory scrutiny on rollover advice |
Focus‑based differentiation themes (where firms win)
- Tax depth as a wedge: Firms integrating year‑round tax (prep, planning, entity work) demonstrate higher share of wallet and retention; multiple RIAs have accelerated M&A into CPA firms to institutionalize this edge.
- Lending + balance sheet: Bank‑owned platforms drive superior revenue/client via securities‑based lending, mortgages, and cash NIM—defensible against pure‑play fee competitors in rising‑rate environments.
- Alternatives access and curation: Advisors serving HNW/UHNW increasingly compete on curated alts menus (private credit, PE secondaries, interval funds). Platforms like iCapital (>$170B platform assets) and CAIS (>$25B) are enabling independent channels.
- Distribution “owned” funnels: National marketers (direct‑to‑investor) convert at scale with centralized investment management (e.g., Fisher Investments, Edelman FE); workplace channels (stock plans, 401(k)s) provide advantaged lead flow to wirehouses and hybrid B/Ds.
- UHNW family‑office services: Billing, reporting, governance, and multi‑jurisdiction trust work are sticky and price‑insensitive; multifamily office platforms are consolidating to add alternatives origination and tech.
Competitive positioning by client segment (selected)
| Segment | Most competitively advantaged models today | Why they win | Where challengers can attack |
|---|---|---|---|
| Mass affluent | Hybrid robo at scale; national RIAs | Low pricing, brand trust, digital CX, embedded cash economics | Hyper‑local RIAs with tax packages; employer‑embedded advice |
| HNW | Wirehouses; private banks; scaled RIAs | Breadth (lending, alts), advisor density, onboarding speed | Tax‑led RIAs; boutique banks with white‑glove credit |
| UHNW | Private banks; MFOs | Trust/credit lock‑in; direct deals; family governance | Bespoke MFOs with CIO bench; independent trustees; deal clubs |
Implications for a private equity thesis
- Roll‑up runway remains strongest in tax‑led and planning‑centric RIAs serving HNW households; diligence integration maturity (custodian mix, investment centralization, planning/tax systems) and organic growth above industry GDP‑plus.
- MFO platforms can command premium valuations where they demonstrate repeatable UHNW acquisition, institutional CIO process, and proprietary co‑investment access; however, operating leverage is lower—underwrite via cross‑sell attach rates and pricing discipline.
- Hybrid/B‑D platforms (advisor networks) monetize recruiting and product shelf economics; value creation hinges on payout optimization, advisor productivity tooling, and alternatives distribution partnerships.
- Banking‑adjacent wealth (trust companies, niche private banks) offers defensible economics through credit and trust; capital intensity and regulatory friction require careful structuring.
- Distribution moats (workplace, stock plan, digital funnel) are key; prioritize targets with advantaged lead sources versus pure referral‑only shops.
Key data points and named examples to anchor sizing/comparables
- Global personal financial wealth ~$250T+; mid‑single‑digit CAGR outlook through 2027.
- US retail/advised investable assets ~$70T+; RIA channel share rising, wirehouse share gradually declining.
- iCapital reports surpassing ~$170B in platform assets; CAIS discloses >$25B—evidence of expanding alternatives penetration into HNW/retail channels.
- Morgan Stanley Wealth Management reports multi‑trillion client assets and outsized firm earnings contribution, underscoring the power of integrated banking + wealth.
- Large independent RIAs: Creative Planning (claims >$300B AUM/AUA), Mariner (~$100B+), Edelman Financial Engines (>$250B). MFOs: Pathstone (>$100B after recent combinations).
Suggested next steps
- Build a bottoms‑up market map of RIAs >$1B AUM with in‑house tax/estate to identify platform roll‑up candidates; segment by custodian, tech stack, and planning centralization.
- For UHNW exposure, diligence MFO platforms with documented co‑investment track records (look‑through to realized outcomes), family governance bench, and scalable reporting ops.
- Evaluate partnerships with alt platforms (iCapital/CAIS) to enhance target revenue per client; assess compliance/program economics and advisor adoption.
- In hybrid/B‑D targets, analyze advisor cohort productivity, payout grid, and product revenue mix to quantify margin expansion levers.
- Where banking adjacency is absent, test SBL partnerships/white‑label trust solutions to approximate private‑bank economics without a balance sheet.
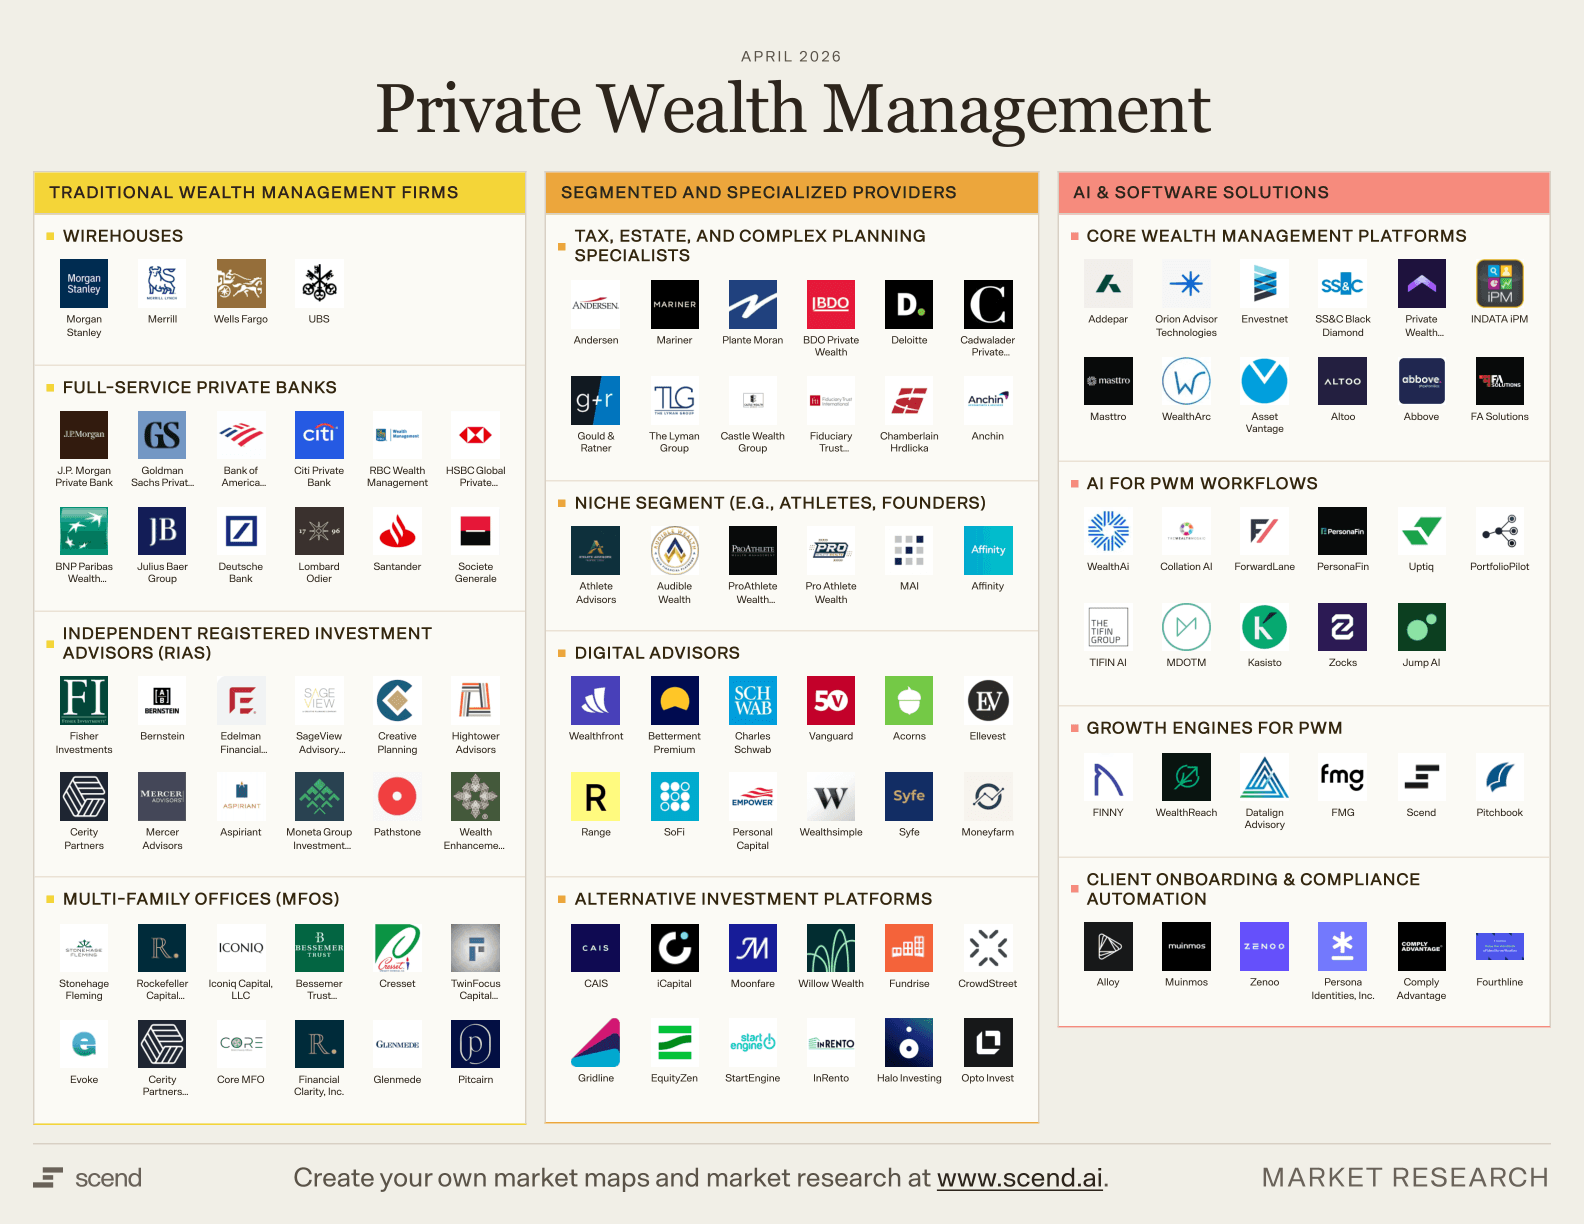
AI and Software Tooling in Private Wealth Management
Book a demo to continue reading the rest of this report and see how Scend generates custom market research, segmentation, and buyer-side intelligence.
Largest Notable PE-Backed Companies
Key takeaways for deal teams
- PE-backed platforms dominate RIA/wealth roll-ups; most large serial acquirers are sponsor-owned or sponsor-backed. Expect continued consolidation pressure on independents and rising competition for quality targets (per DeVoe & Company’s RIA M&A reports, sponsor-backed acquirers account for the majority of annual deals).
- Scale benefits are accruing in distribution, shared services (tax, trust, alternatives access), and vendor pricing; platforms with deep integration playbooks and advisor recruiting engines are outgrowing peers.
- Valuation dispersion remains high by mix (UHNW vs. mass affluent, workplace, retirement), organic growth, and margin profile. Sponsor choice and capital structure affect M&A pace amid higher rates.
Largest notable PE-backed platforms rolling up private wealth
| Company | Latest reported client assets (AUM/AUA) and date | PE sponsor(s) | Ownership status | Roll-up footprint / recent activity | Primary positioning |
|---|---|---|---|---|---|
| Focus Financial Partners | c. $350B+ client assets (Aug 2023, at take-private close) | Clayton, Dubilier & Rice (CD&R) | Taken private by CD&R in 2023 | 85+ partner firms; long-running RIA affiliate model; active programmatic M&A | RIA aggregator across HNW/UHNW, multi-firm partnership platform |
| Edelman Financial Engines | >$270B client assets (Apr 2021) | Hellman & Friedman (majority); Warburg Pincus (minority, 2021) | Sponsor-controlled | Large workplace managed-accounts plus retail planning; selective tuck-ins | Hybrid workplace + retail planning at scale; mass affluent to HNW |
| CAPTRUST | c. $830B+ client assets; c. $150B+ AUM (company “About,” 2024) | GTCR (minority, 2020) | Founder-led with PE minority | Active M&A in wealth and retirement/OCIO; national footprint | Dual engine: institutional retirement/OCIO + private wealth |
| Creative Planning | c. $245B+ AUM pre-transaction; +~$29B from Goldman Sachs PFM acquisition (Aug 2023) | General Atlantic (significant minority; initial 2020, additional 2023) | Founder-led with PE minority | Aggressive M&A and lift-outs; acquired Goldman Sachs PFM | Holistic planning at scale; alt access and tax services build-out |
| Hightower Advisors | c. $130B AUM (company data, 2023 YE) | Thomas H. Lee Partners (majority, 2018) | Sponsor-controlled | 50+ deals since 2019; platform/anchor and minority investment approach | RIA partnership model with centralized services |
| Corient (CI Private Wealth US) | c. $150B+ client assets (company site, 2024) | CI Financial (corporate parent) with a consortium of institutional investors holding minority stake(s) since 2022 | Strategically controlled by CI; minority external investors | One of the fastest roll-ups 2020–2023; multi-billion EV minority stake sales to fund M&A | HNW/UHNW RIA aggregation; national brand consolidation |
| Mariner Wealth Advisors | c. $100B+ client assets (company/press, 2023–2024) | Leonard Green & Partners (majority, 2021) | Sponsor-controlled | Dozens of acquisitions; expansion into tax, trust, and retirement | Full-stack planning with in-house tax/trust; HNW focus |
| Mercer Advisors | ~ $50–60B AUM (company/press, 2023–2024) | Genstar Capital (lead); Oak Hill Capital | Sponsor-controlled | 75+ acquisitions cumulatively; deep back-office integration | Comprehensive planning; strong tax/estate platform |
| Wealth Enhancement Group (WEG) | ~ $60–70B+ client assets (company press, 2023) | TA Associates (lead); Onex Partners (minority, 2021) | Sponsor-controlled with minority co-invest | 100+ offices; frequent tuck-ins across the U.S. | Mass affluent/HNW; centralized investment/tax resources |
| Beacon Pointe Advisors | ~$30B+ AUM (company press, 2023) | KKR (minority growth, 2021) | Founder-led with PE minority | Steady cadence of regional RIAs; women-led advisor brand strength | HNW/UHNW with institutional OCIO heritage |
| Pathstone | >$100B+ client assets (AUM/AUA combined, 2023) | Lovell Minnick Partners; Kelso & Company (new investor, 2022) | Sponsor-backed | Family office and UHNW-focused acquisitions; multi-family office roll-up | UHNW/MFO with alternatives, trust, and bill pay |
| Savant Wealth Management | ~$20B+ AUM (company site, 2023–2024) | Kelso & Company (growth investment, 2023) | Founder-led with PE minority | Regional tuck-ins; technology-enabled planning | HNW with in-house tax/accounting and 401(k) advisory |
Notes
- "Client assets" reflect how firms report (AUM, AUA, or total client assets). Figures are rounded and based on the most recent public disclosures cited below; reporting dates vary.
- Many platforms operate multi-brand strategies with varying degrees of integration; due diligence should segment organic growth vs. M&A, fee yields, and margin capture by service line (planning, investment management, tax/estate, trust, alternatives access).
Implications and diligence angles
- Pipeline durability: Assess each platform’s signed/LOI pipeline, sourcing channels (bank/RIA carve-outs, wirehouse breakaways), and win rates; higher rates elevate financing hurdles for large platforms reliant on debt.
- Integration and synergy capture: Validate centralization of investment, trading, billing, compliance, and tax/trust; quantify margin expansion post-integration vs. “federation” models.
- Advisor retention risk: Review earnout structures, rollover equity performance, and net advisor hiring; analyze ACATS outflows and NPS post-integration.
- Mix-driven valuation: Workplace advice (EFE) trades differently than pure RIA; UHNW/MFO (Pathstone) can support higher margins and alt fee capture. Compare unit economics before extrapolating comps across subsegments.
- Cross-sell and product breadth: Tax, trust, and alternatives distribution are key differentiators—firms with in-house capabilities and scaled vendor economics are better positioned to lift revenue per household.
Valuation Expectations
What drives valuation in private wealth management (PWM)
- Revenue model and stability
- Recurring fee-based revenue share: RIAs typically >70–90% recurring AUM fees; higher mix commands premium due to cashflow visibility. [Benchmarked by Schwab RIA studies.]
- Revenue yield on AUM (ROA): commonly 55–85 bps for affluent/HNW RIAs; UHNW/MFO models often 40–70 bps but with superior retention and cross‑family longevity.
- Profitability and scale
- EBITDA margins: ~15–25% for subscale practices; ~20–35% at $1B+ AUM platforms with centralized ops; top-quartile scaled firms can exceed low‑30s.
- Growth and durability
- Organic NNA: low- to mid‑single‑digit % of AUM is common for core RIAs; top performers sustain high‑single‑digit.
- Client retention typically >95% annually for established wealth managers, supporting long-duration cash flows.
- Risk/quality factors that re-rate multiples
- Client concentration (<10% of revenue from any one client), pricing power, next‑gen client penetration, share of wallet (planning/banking/alternatives), compliance history, and clean portability with custodians/IBDs.
Indicative private-market valuation ranges (U.S. RIAs and wealth managers)
Ranges reflect mid‑cycle private deal observations triangulated from DeVoe & Company, ECHELON Partners, and Mercer Capital. Actual pricing varies with growth, margin, and deal structure. EV as % of AUM is a rule‑of‑thumb derived from typical revenue yields and revenue multiples (illustrative).
| Segment (typical profile) | Revenue yield on AUM (bps) | EBITDA margin | EV / EBITDA | EV / Revenue | Enterprise value as % of AUM (derived) | Notes |
|---|---|---|---|---|---|---|
| Independent RIA (<$1B AUM) | 70–90 | 15–25% | 5–8x | 1.5–2.5x | ~1.0–2.0% | Smaller teams, founder‑led; greater key‑person and client‑concentration risk depress multiples. |
| Independent RIA ($1–5B AUM) | 60–80 | 20–30% | 8–12x | 2.0–3.0x | ~1.2–2.4% | Scale benefits from shared ops/marketing; growth and tuck‑in cadence are key re‑rating drivers. |
| Scaled national/platform RIA ($5–25B AUM) | 55–75 | 25–35% | 11–16x | 2.5–3.5x | ~1.4–2.6% | Centralized operations, M&A engine, professional management; premiums for strong organic NNA and low churn. |
| UHNW / Multi‑Family Office (service‑heavy) | 40–70 | 20–30% | 9–14x | 2.0–3.0x | ~0.8–2.1% | Lower ROA but very sticky relationships and cross‑family mandates; margins depend on concierge scope. |
| IBD/OSJ or hybrid advisory books | n/a (often blend of fees/commissions) | 15–25% (post‑payout) | 6–9x | 1.0–2.0x of gross revenue | n/a | Valuation sensitive to commission mix, payout grids, and recruiting pipeline; portability risk to home office. |
Notes:
- Public comps (e.g., LPL Financial, Raymond James, St. James’s Place) typically trade in low‑ to mid‑teens forward P/E and single‑ to low‑double‑digit EV/EBITDA through 2022–2024; private RIA assets with higher growth/visibility can transact at a premium to these headline EBITDA multiples. Use with caution due to business‑mix differences (brokerage, spread income, capital intensity).
- In 2023–2025, higher rates boosted spread/sweep economics for broker/dealers and custodians, temporarily elevating EBITDA; underwriting should normalize these effects when valuing RIAs not directly earning spread.
Deal structure and adjustments observed in RIA transactions
- Consideration mix: Cash at close plus meaningful earn‑outs and/or rollover equity is common to bridge growth/margin underwrites and AUM beta; structure varies widely by size and buyer type.
- Performance metrics in earn‑outs: AUM/Revenue stability, net new assets, and EBITDA are the most frequent; some deals include client/employee retention thresholds.
- Normalizations: Remove founder over/under‑comp, non‑recurring owner perks, and market‑beta windfalls (e.g., unusually high sweep yields, temporary fee discounts or fee holidays) to get to steady‑state EBITDA.
- Working capital and capex: RIAs are light‑capex; QoE should focus on deferred comp, technology subscriptions, and transition costs for custodian or IBD changes.
Underwriting implications for a PE buyer
- Focus diligence on:
- Organic NNA by channel/advisor, pricing discipline (realized bps), client concentration, and age/cohort analysis to gauge decumulation risk.
- Margin durability levers: centralized ops ratio, advisor productivity (AUM/advisor, revenue/employee), and vendor stack costs.
- Platform synergies: ability to add planning, tax, trust, lending, and alternatives distribution to lift ROA 5–15 bps without eroding retention.
- Valuation guardrails to consider in LOIs:
- Calibrate EV/EBITDA and EV/Revenue to pro‑forma, cycle‑normalized earnings; use AUM‑based heuristics only as a cross‑check.
- Tie contingent consideration to net new fee revenue or EBITDA to protect against market drawdowns.
Data gaps and interpretation
- Private RIA deal data is opaque; reported ranges aggregate advisor surveys and selective disclosures. Use third‑party QoE and multiple data points (DeVoe, ECHELON, Mercer Capital, custodian benchmarking) to triangulate fair value for a specific target, rather than relying on a single rule‑of‑thumb.
Relevant Precedent Transactions
Book a demo to continue reading the rest of this report and see how Scend generates custom market research, segmentation, and buyer-side intelligence.
Upcoming Conferences and Industry Events
Briefing note
- Use these recurring conferences to source deal flow (wealthtech, alts distribution), validate buyer demand (RIAs, broker-dealers, custodians), and cultivate LP/FO co-investor relationships. 2026 dates are typically announced 4–9 months prior; below shows expected windows based on prior years. Attendance figures are historical ranges from organizer pages or trade coverage; confirm when 2026 agendas post.
Priority events (next 12 months; dates TBC)
| Event | Typical 2026 timing (TBC) | Recent location | Core audience | PE relevance | Est. attendance (historical) |
|---|---|---|---|---|---|
| Schwab IMPACT | Oct–Nov | Rotates (e.g., Philadelphia/Denver) | RIAs, custodians, tech vendors | RIA platform pulse; channel partnerships; assess custodian roadmaps | ~4,000–6,000 |
| BNY Mellon Pershing INSITE | June | Orlando/Las Vegas | RIAs, broker-dealers, bank wealth | Distribution partnerships; custody/clearing ecosystem; practice mgmt tech | ~2,000–3,000 |
| Morningstar Investment Conference (MICUS) | April–May | Chicago | Advisors, asset managers, research/analytics vendors | Portfolio construction/Model marketplaces; advisor analytics buyers | ~1,500–2,500 |
| Wealth Management EDGE (Inside ETFs, RIA Edge, WealthStack) | May–June | Hollywood, FL | RIAs, ETF issuers, fintech | Wealthtech BD (WealthStack); ETF/SMAs distribution; RIA M&A execs | ~3,000+ total; ~2,000+ advisors |
| Future Proof Festival | Sept | Huntington Beach, CA | RIAs, wealthtech, asset managers | High meeting density; fintech pilots; emerging advisor demographics | ~3,000–4,000 |
| iConnections Global Alts | Jan | Miami Beach, FL | Alts managers, family offices, allocators | Alts access/distribution; FO co-invest; meetings platform built-in | ~3,000–5,000 |
| SALT New York | Sept | New York, NY | Hedge funds, PE/VC, family offices | UHNW/FO access; alts distribution; thought leadership for deal origination | ~1,500–3,000 |
| Envestnet Elevate (Advisor Summit) | May | Denver/Las Vegas | Envestnet clients, RIAs, enterprises | Data/analytics, TAMPs, exchanges; partner integrations | ~1,500–2,500 |
| Nitrogen (Riskalyze) Fearless Investing Summit | Oct | Phoenix/Las Vegas | Growth-minded RIAs, fintech | Advisor lead-gen and practice OS buyers; mid-market RIA decision makers | ~1,000–2,000 |
| Heckerling Institute on Estate Planning | Jan | Orlando, FL | Estate attorneys, trust cos, private wealth | Tax/estate depth; trust services adjacencies; UHNW referral networks | ~2,500–3,500 |
| AICPA & CIMA ENGAGE (incl. PFP track) | June | Las Vegas, NV | CPAs, personal financial planners | Cross-sell tax + wealth; CPA channel partnerships for RIA roll-ups | ~3,000–5,000 (multi-track) |
| Opal Family Office & Private Wealth Forum – East | July | Newport, RI | SFOs/MFOs, managers, private banks | UHNW sourcing; feeder/fund platform relationships | ~800–1,500 |
| MMI Annual Conference | Oct | Rotates | Asset mgr/wealth distribution leaders | Product/platform distribution trends; TAMP/UMA partnerships | ~600–900 |
| Barron’s Top Independent Advisors Summit | Mar–Apr | Rotates (SE U.S. frequent) | Top-producing independent advisors | High-AUM producers; buyer personas for wealthtech and alts | ~500–800 (invite-only) |
| VettaFi Exchange ETF Conference | Feb | Miami Beach, FL | Advisors, ETF issuers, market makers | Product access (ETFs, model portfolios); advisor distribution | ~2,000–3,000 |
| Blue Vault Bowman Alts Summit | March | Atlanta, GA | Independent BDs, RIAs, alts sponsors | Intermediated alts distribution (intervals, BDCs, REITs) | ~700–1,000 |
Why these matter for an investment thesis
- Wealthtech and AI tooling: EDGE/WealthStack, Envestnet Elevate, Nitrogen, Future Proof concentrate product buyers (CTOs/COOs/lead advisors) and integration partners (custodians, TAMPs). Prioritize hosted meeting rooms and live demos to validate pricing and procurement cycles.
- Alts access/distribution: iConnections, SALT, Blue Vault, Opal convene alts platforms, sponsors, and UHNW/MFO allocators. Useful to map feeder funds, interval fund distributors, and sub-doc platforms; pre-book allocator 1:1s via event apps.
- RIA consolidation/platform plays: Schwab IMPACT, Pershing INSITE, MMI, Barron’s surface pain points in workflow, compliance, client acquisition—informing value-creation levers for roll-ups (custody pricing, advisor comp grids, tech stacks).
- Tax/estate adjacency: Heckerling and AICPA ENGAGE expose cross-sell opportunities (trust admin, entity mgmt, complex K-1/tax), and potential acquisition targets in fiduciary services.
Tactical guidance for a deal team
- Meeting density: Aim 15–25 pre-booked meetings per attendee at iConnections/EDGE/Future Proof using the event matchmaking apps; reserve a private room versus booth if pipeline goals exceed ~$3–5m ARR from the channel.
- Sponsorship calculus: Packages that include speaking slots + hosted roundtables materially lift top-of-funnel; negotiate opt-in attendee lists and app messaging to improve CAC payback.
- Coverage map: Split resources—one track for alts allocator 1:1s (iConnections/SALT/Opal) and one for RIA ops/tech buyers (EDGE/Elevate/Nitrogen). Add a legal/tax scout for Heckerling if building trust/estate capabilities.
- Lead times: Abstract submissions and premium sponsorships close 4–6 months pre-event; hotel blocks often sell out 60–90 days prior.
Notes on data confidence
- Attendance ranges above are based on organizer claims or trade press for recent editions; verify final 2026 figures once agendas publish. Where organizers do not disclose precise counts annually, ranges are intentionally conservative.
Relevant Bankers and Advisors
Book a demo to continue reading the rest of this report and see how Scend generates custom market research, segmentation, and buyer-side intelligence.
Top 20 Acquisition Targets
Book a demo to continue reading the rest of this report and see how Scend generates custom market research, segmentation, and buyer-side intelligence.
Maturity of Market / "Inning"
PWM consolidation is in the middle innings: despite three straight years of elevated RIA M&A (300+ deals annually since 2021, with a majority of buyers PE-backed), the market remains highly fragmented (15k+ SEC‑registered investment advisers; many sub‑$1B AUM) and a sizable advisor succession wave (~40% plan to retire within 10 years) should sustain deal supply and roll‑up logic. The RIA channel continues to gain share and attract breakaways, supporting organic growth, but higher rates have moderated multiples and raised the bar on leverage‑driven returns—favoring scaled platforms with strong compliance/ops, proven organic growth engines, tax/estate depth, and tech/AI that improves advisor productivity and integration. Net: still attractive for PE, but easy multiple arbitrage is fading; focus on add‑on pipelines to high‑quality platforms and thematic builds (UHNW/tax‑led/alt access) where operational value creation can pull forward returns.